
In today’s fast-evolving workplace, HR professionals must leverage data to make strategic decisions. This is where HR metrics come into play. HR metrics are quantifiable data points that help businesses measure workforce effectiveness, optimize HR strategies, and improve overall organizational performance.
With 2025 approaching, organizations must prioritize data-driven HR management to stay competitive. By tracking and analyzing key HR metrics, companies can enhance employee engagement, streamline recruitment, improve retention, and build a high-performing workforce.
In this blog, we will explore the top 20 HR metrics that HR leaders should track in 2025 to drive business success.
In today’s fast-paced business world, HR metrics are no longer optional—they are essential for strategic decision-making. Organizations that rely on data-driven insights rather than gut feelings can make more informed choices, optimize workforce management, and stay ahead of the competition.
HR metrics provide quantifiable evidence of how human capital contributes to business success. Whether it’s measuring recruitment effectiveness, employee engagement, performance, or diversity, HR analytics allows companies to identify trends, predict future workforce challenges, and implement proactive solutions.
📊 1. Enabling Data-Driven Decision-Making
HR leaders no longer have to rely on intuition when making decisions about hiring, performance, or retention. HR metrics provide hard data that validates choices, helping leaders make objective, strategic decisions that align with business goals.
Example: A retail company struggling with high seasonal turnover used predictive HR analytics to identify the best hiring sources for long-term employees. By adjusting recruitment efforts, they reduced turnover by 15% in one year.
📊 2. Identifying Workforce Challenges Early
HR metrics help organizations spot potential problems before they escalate. If turnover rates are rising or employee engagement scores are declining, HR teams can intervene with targeted strategies before these issues impact business performance.
Example: A technology firm noticed a drop in employee engagement scores in a particular department. Upon further investigation, they discovered workload imbalance and lack of career development opportunities. By introducing mentorship programs and workload redistribution, they improved engagement by 20%.
📊 3. Measuring HR Performance and Business Impact
HR functions such as hiring, training, and employee satisfaction directly impact overall business performance. Tracking HR metrics ensures HR teams are meeting key objectives and demonstrating their value to the organization.
Example: A financial services company tracked training ROI and found that employees who completed leadership programs were 30% more likely to be promoted within two years. This data helped justify increased investment in leadership development initiatives.
📊 4. Optimizing Hiring, Retention, and Employee Engagement
HR metrics help companies refine their recruitment and retention strategies. By analyzing hiring success rates, cost per hire, and turnover patterns, organizations can ensure they attract and retain the right talent.
Example: An e-commerce company found that employees who participated in structured onboarding programs were 40% more likely to stay beyond one year. As a result, they revamped their onboarding process, leading to improved retention rates.
With the rise of AI and big data, HR metrics are becoming even more powerful. Companies now use advanced analytics tools to predict future workforce trends, identify skills gaps, and personalize employee experiences. Businesses that embrace HR analytics can expect higher efficiency, stronger employee satisfaction, and a more competitive edge in the market.
📌 Industry Insight: A study by McKinsey found that data-driven HR practices can improve workforce productivity by up to 25%. Companies that leverage HR analytics outperform their competitors in employee retention, engagement, and overall profitability.
HR metrics are not just about tracking data—they empower HR leaders to drive meaningful change within organizations. By leveraging real-time analytics, predictive modeling, and employee insights, HR can play a pivotal role in business strategy. The future of HR is data-driven, proactive, and deeply integrated with overall business success.
Every data point tells a story—but only when you know where to look.
HR metrics are no longer “nice-to-have” insights buried in spreadsheets. In today’s data-driven HR landscape, they are essential tools for making smarter, faster, and fairer people decisions. Whether you’re trying to optimize your hiring funnel, boost employee engagement, ensure pay equity, or reduce workplace risks, having the right metrics in place empowers you to act with clarity and confidence.
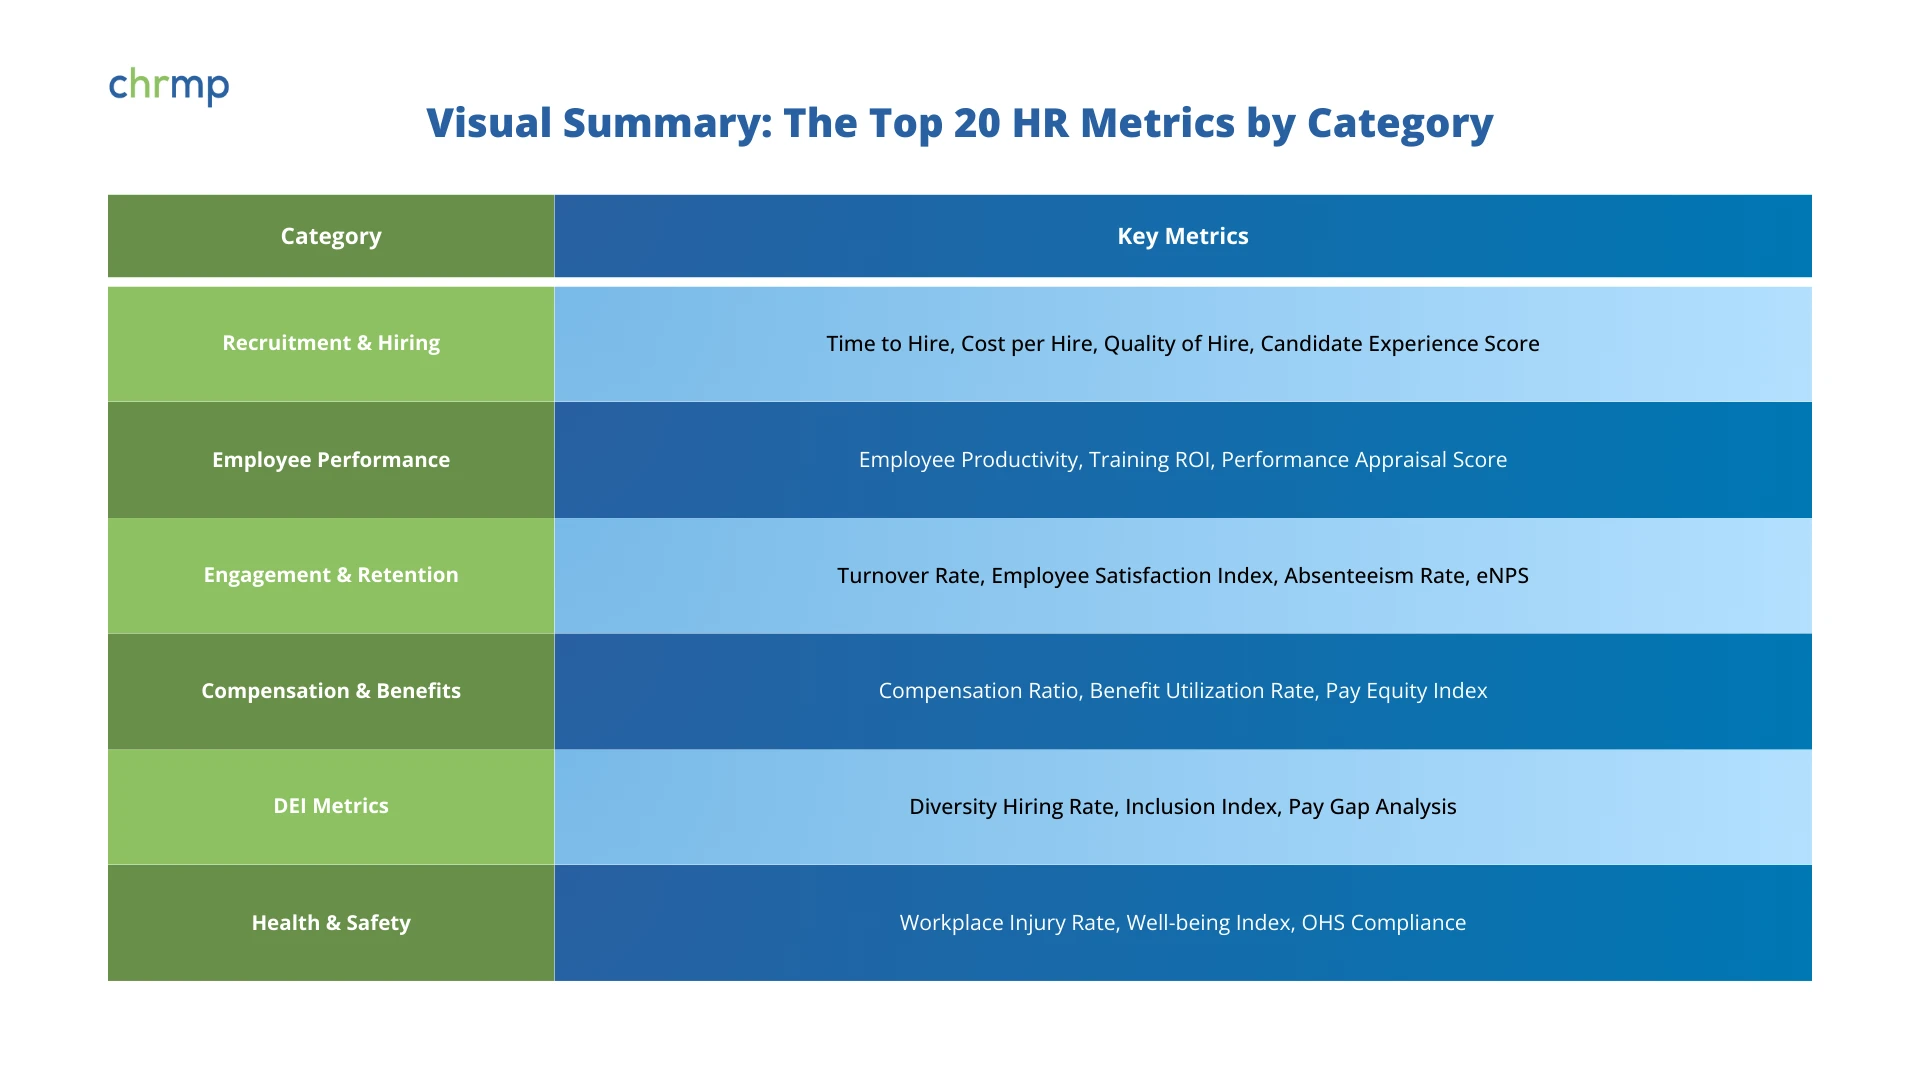
To bring structure to your analytics strategy, HR metrics can be grouped into six key categories—each offering unique insights into different dimensions of the employee experience. Let’s explore them one by one.
Recruiting the right talent is one of the most critical functions of any HR department. However, hiring isn’t just about filling a vacancy—it’s about doing it efficiently, cost-effectively, and in a way that builds long-term organizational strength. That’s why recruitment metrics are essential. They provide valuable insights into how well your hiring process is functioning and highlight areas for improvement.
1.1 Time to Hire
Definition:
Time to Hire refers to the number of days between when a candidate applies (or is sourced) and the day they accept the job offer.
Formula:
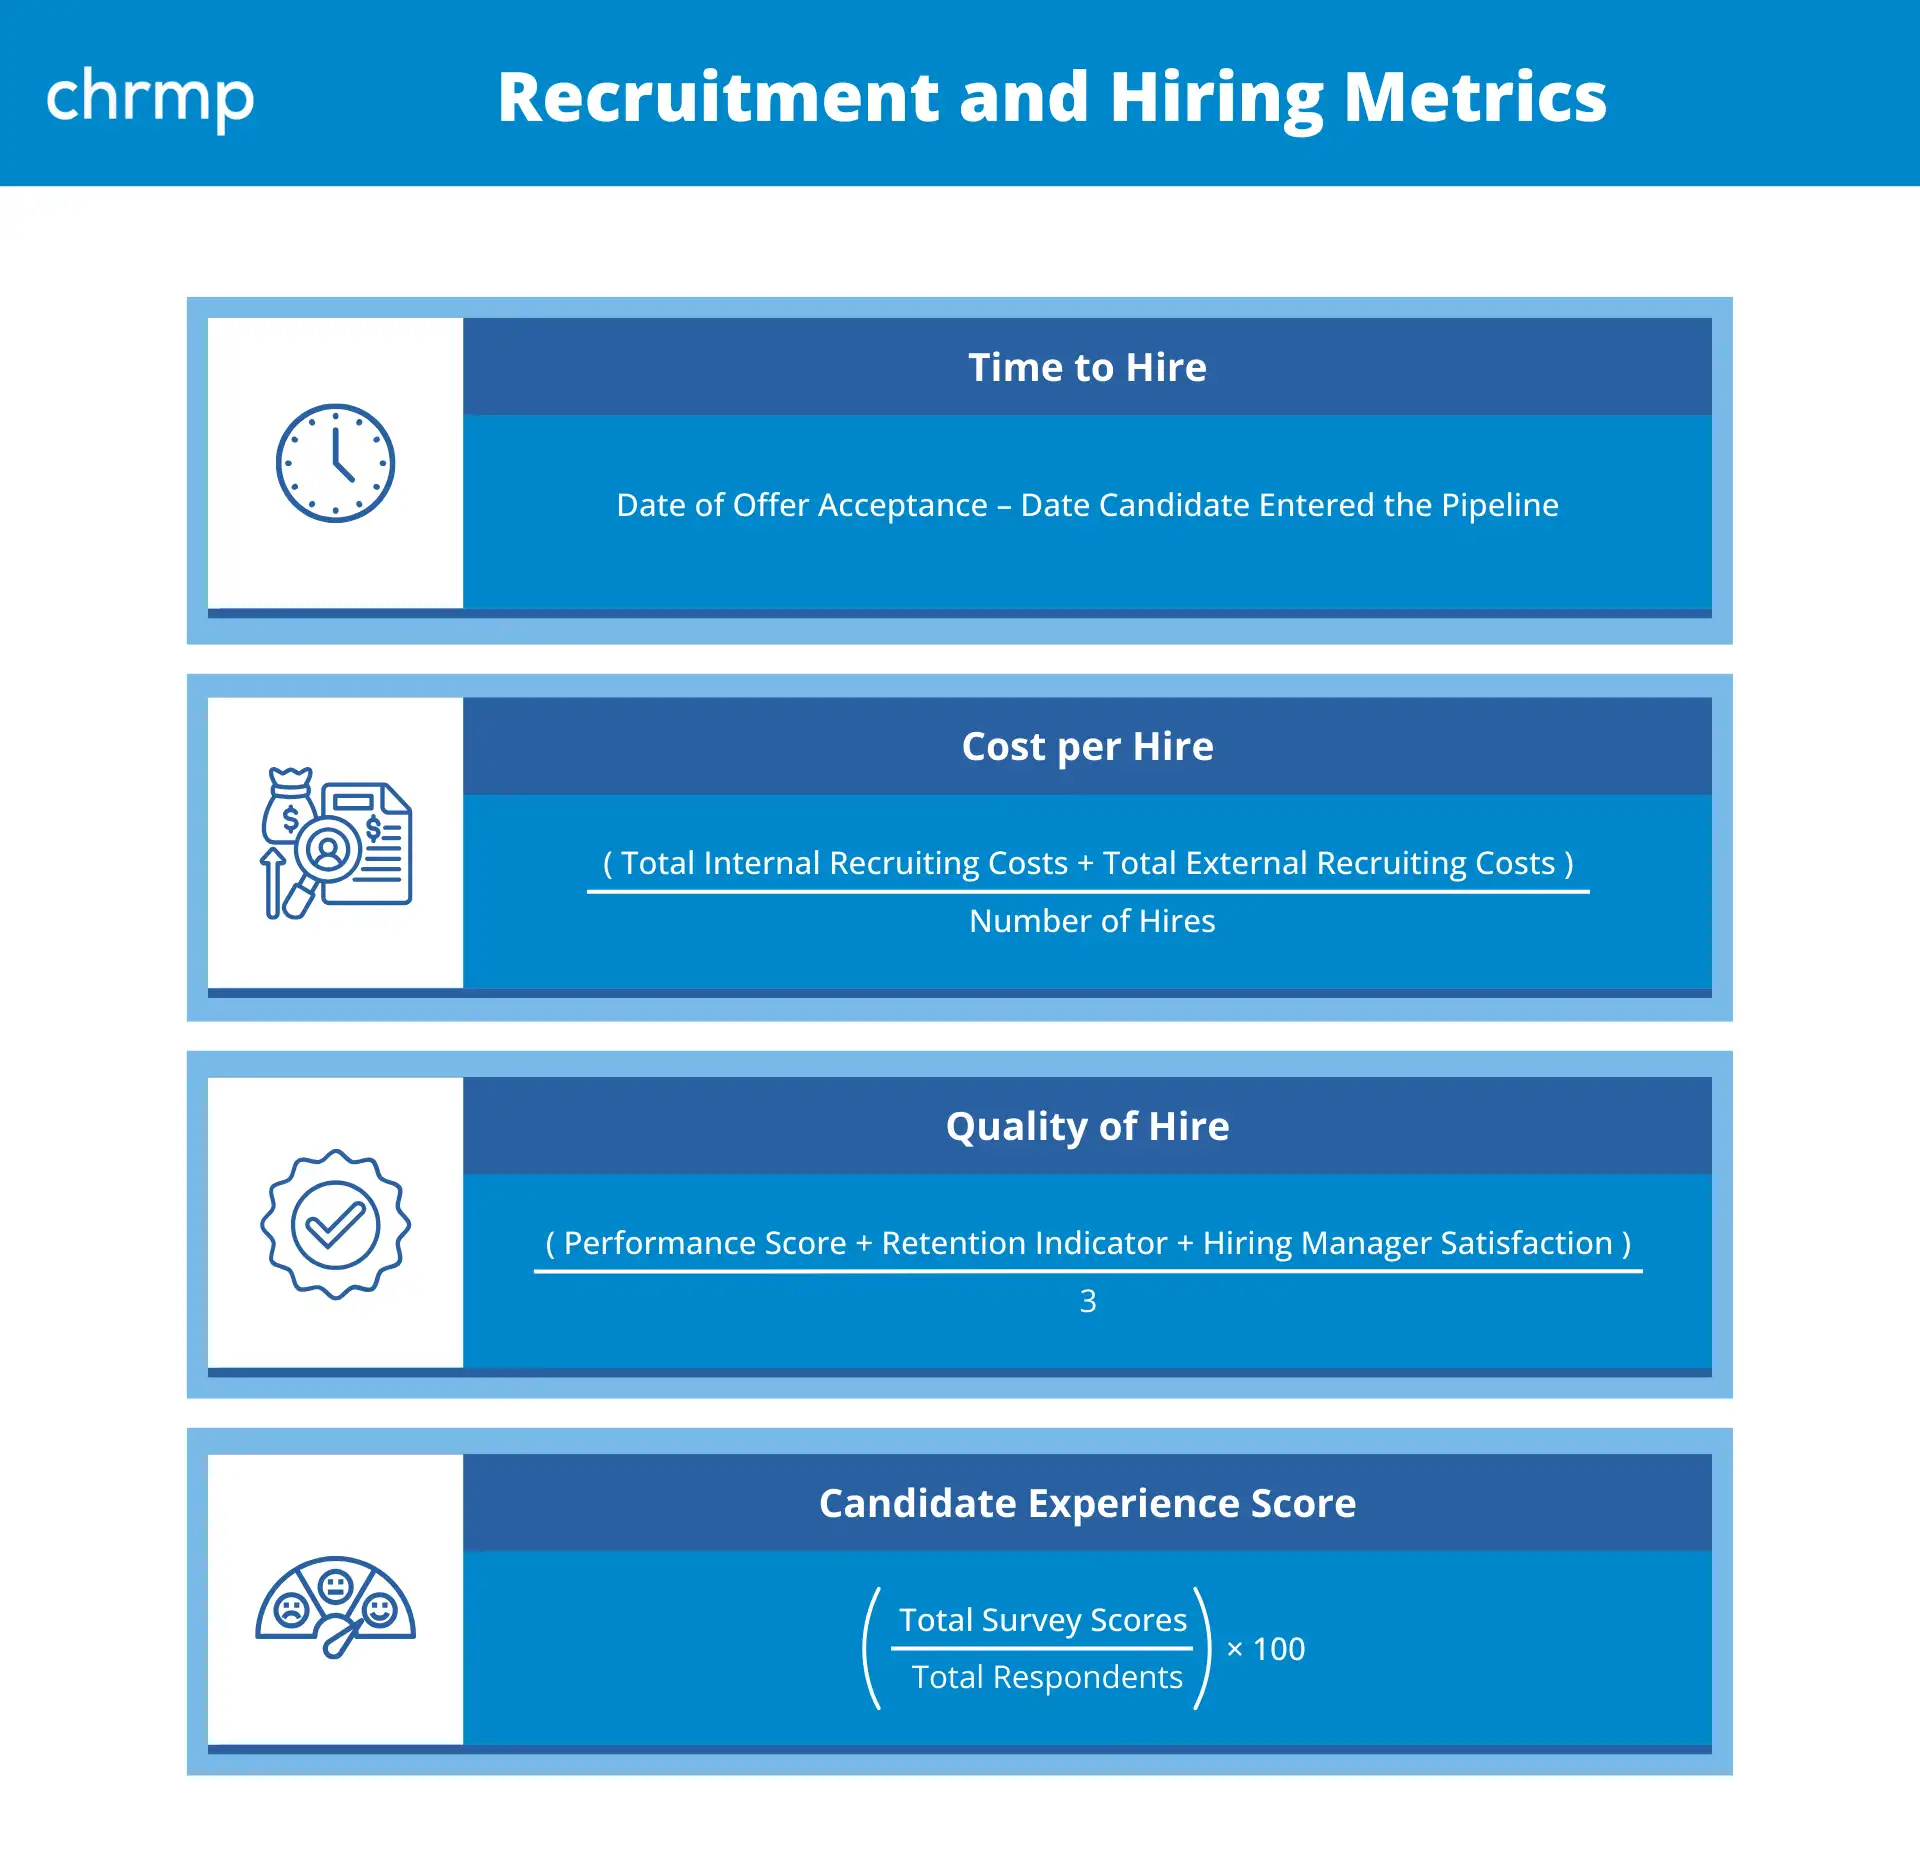
Time to Hire = Date of Offer Acceptance – Date Candidate Entered the Pipeline
Why It Matters:
A drawn-out hiring process can cost you the best candidates. High-caliber talent is in demand, and if your organization is too slow to move, competitors will snap them up. Time to Hire is a strong indicator of how efficient your recruitment process is—and where it might be lagging (e.g., too many interview rounds or delays in decision-making).
Example Use Case:
An HR team noticed their time to hire was averaging over 45 days. After evaluating the process, they discovered bottlenecks during the manager review stage. By automating resume screening and scheduling interviews faster, they reduced this metric to 25 days, leading to fewer candidate drop-offs and quicker onboarding.
1.2 Cost per Hire
Definition:
This metric calculates the total cost involved in hiring a new employee, including both internal and external expenses.
Formula:
Cost per Hire = (Total Internal Recruiting Costs + Total External Recruiting Costs) / Number of Hires
Why It Matters:
Cost per Hire provides a clear view of the financial efficiency of your recruitment efforts. Tracking this helps you manage your hiring budget better and identify which sources are the most cost-effective. It also supports better ROI calculations for recruitment campaigns.
What’s Included:
Example Use Case:
A company discovered that agency hires were significantly inflating their cost per hire. By investing in an in-house sourcing team and leveraging employee referrals, they lowered their average cost per hire by 35% over the next six months.
1.3 Quality of Hire
Definition:
Quality of Hire measures the value a new employee adds to the company over time, often using factors like performance, productivity, retention, and feedback from hiring managers.
Formula (Composite Score Example):
Quality of Hire = (Performance Score + Retention Indicator + Hiring Manager Satisfaction) / 3
Why It Matters:
Hiring fast and cheap means nothing if your new hires underperform or leave quickly. Quality of Hire ensures that you’re not just filling seats but hiring the right people who contribute meaningfully to business goals.
How to Measure:
Use a combination of:
Example Use Case:
An organization noticed that high-scoring interviewees were underperforming after onboarding. After revisiting their competency-based interview questions and adding job simulations, they improved quality of hire scores and reduced early turnover by 20%.
1.4 Candidate Experience Score
Definition:
This metric evaluates a job applicant’s overall perception of your hiring process, typically collected through post-interview surveys.
Formula:
Candidate Experience Score = (Total Survey Scores / Total Respondents) × 100
Why It Matters:
A poor candidate experience can hurt your employer brand—even among applicants who don’t get the job. Positive experiences, on the other hand, build a stronger talent pipeline, increase reapplication rates, and can even boost customer loyalty.
What to Ask in Surveys:
Example Use Case:
After receiving feedback that candidates felt ghosted post-interview, one HR team implemented automated status updates and post-interview thank-you emails. Their candidate experience score rose by 25%, and more applicants began referring friends.
Final Thoughts on Recruitment Metrics
By consistently tracking these recruitment KPIs, HR professionals can move beyond gut instinct and make smarter, evidence-based hiring decisions. The goal isn’t just to hire quickly or cheaply—but to hire effectively, ensuring every new addition is a win for both the company and the candidate.
How do you really know if your employees are thriving—or just surviving?
That’s a question every HR leader and manager should ask themselves. Hiring the right talent is only half the battle. The real test comes after onboarding—how well do your employees perform, grow, and contribute to your organizational goals?
This is where employee performance metrics come in. These data points give you a real-time lens into how individuals, teams, and departments are doing. Instead of relying solely on anecdotal feedback or annual reviews, performance metrics give HR professionals the insights they need to coach, develop, and retain top talent.
Let’s explore the most essential performance-related HR metrics you should be tracking:
2.1 Employee Productivity Rate
Definition:
Measures how much output (e.g., tasks completed, revenue generated, services delivered) an employee produces within a specific period compared to input (e.g., hours worked).
Formula:
Employee Productivity Rate = Total Output / Total Input
Why It Matters:
If productivity is declining, it might not be the employee’s fault—it could be due to outdated tools, unclear goals, or low morale. Measuring productivity helps identify not just top performers, but also those who might need support or restructuring.
Example Use Case:
A mid-sized logistics company realized warehouse productivity dipped during night shifts. Further analysis revealed a lack of supervisory presence and outdated scanning tools. Addressing these improved the productivity rate by 18%.
2.2 Training Return on Investment (ROI)
Definition:
Assesses how much value a company gains from its training programs compared to what it spent.
Formula:
Training ROI (%) = [(Benefit from Training – Training Cost) / Training Cost] × 100
Why It Matters:
Not all training is created equal. Some programs truly upskill your workforce, while others might just tick boxes. ROI helps you determine which learning initiatives drive real business impact—so you can double down on what works.
How to Evaluate Benefits:
Example Use Case:
A customer support team rolled out a new AI chatbot training. Post-training, first-contact resolution improved by 20%, and call volume decreased, leading to measurable cost savings. The ROI validated the expansion of training across other departments.
2.3 Performance Appraisal Score
Definition:
A score derived from an employee’s performance evaluation, usually tied to specific KPIs or competency ratings.
Formula (if using a weighted system):
Performance Score = (KPI Weight × KPI Achievement % for each metric) summed across all metrics
Why It Matters:
Performance appraisals, when done right, offer more than just a raise or promotion—they become a roadmap for development. Tracking appraisal scores helps HR identify patterns, coach underperformers, and celebrate excellence.
What to Include in Evaluation:
Example Use Case:
An IT company integrated quarterly performance scores into their talent review process. They found that employees with consistent high scores were 3x more likely to be retained, helping them prioritize retention efforts.
Wrapping Up This Section
Employee performance metrics help answer some of the most important questions in HR: Are we helping our people succeed? Are we rewarding the right behaviors? And are we investing wisely in development? By tracking these metrics consistently, HR can guide performance management from reactive to proactive—leading to a more engaged, capable, and high-achieving workforce.
What makes an employee stay? What drives them to leave?
If you’ve ever lost a high-performing employee unexpectedly, you know the pain of wondering if you could have done something differently. Engagement and retention metrics aim to take the guesswork out of this question. They help HR teams understand not just who’s staying or leaving—but why.
Engaged employees bring more than just productivity to the table—they bring innovation, positivity, and loyalty. When engagement drops, attrition often follows. These metrics help organizations proactively shape a culture where people want to stay and grow.

Let’s dive into the core metrics that help you measure and manage employee engagement and retention.
3.1 Employee Turnover Rate
Definition:
The percentage of employees who leave the company within a specific period, either voluntarily or involuntarily.
Formula:
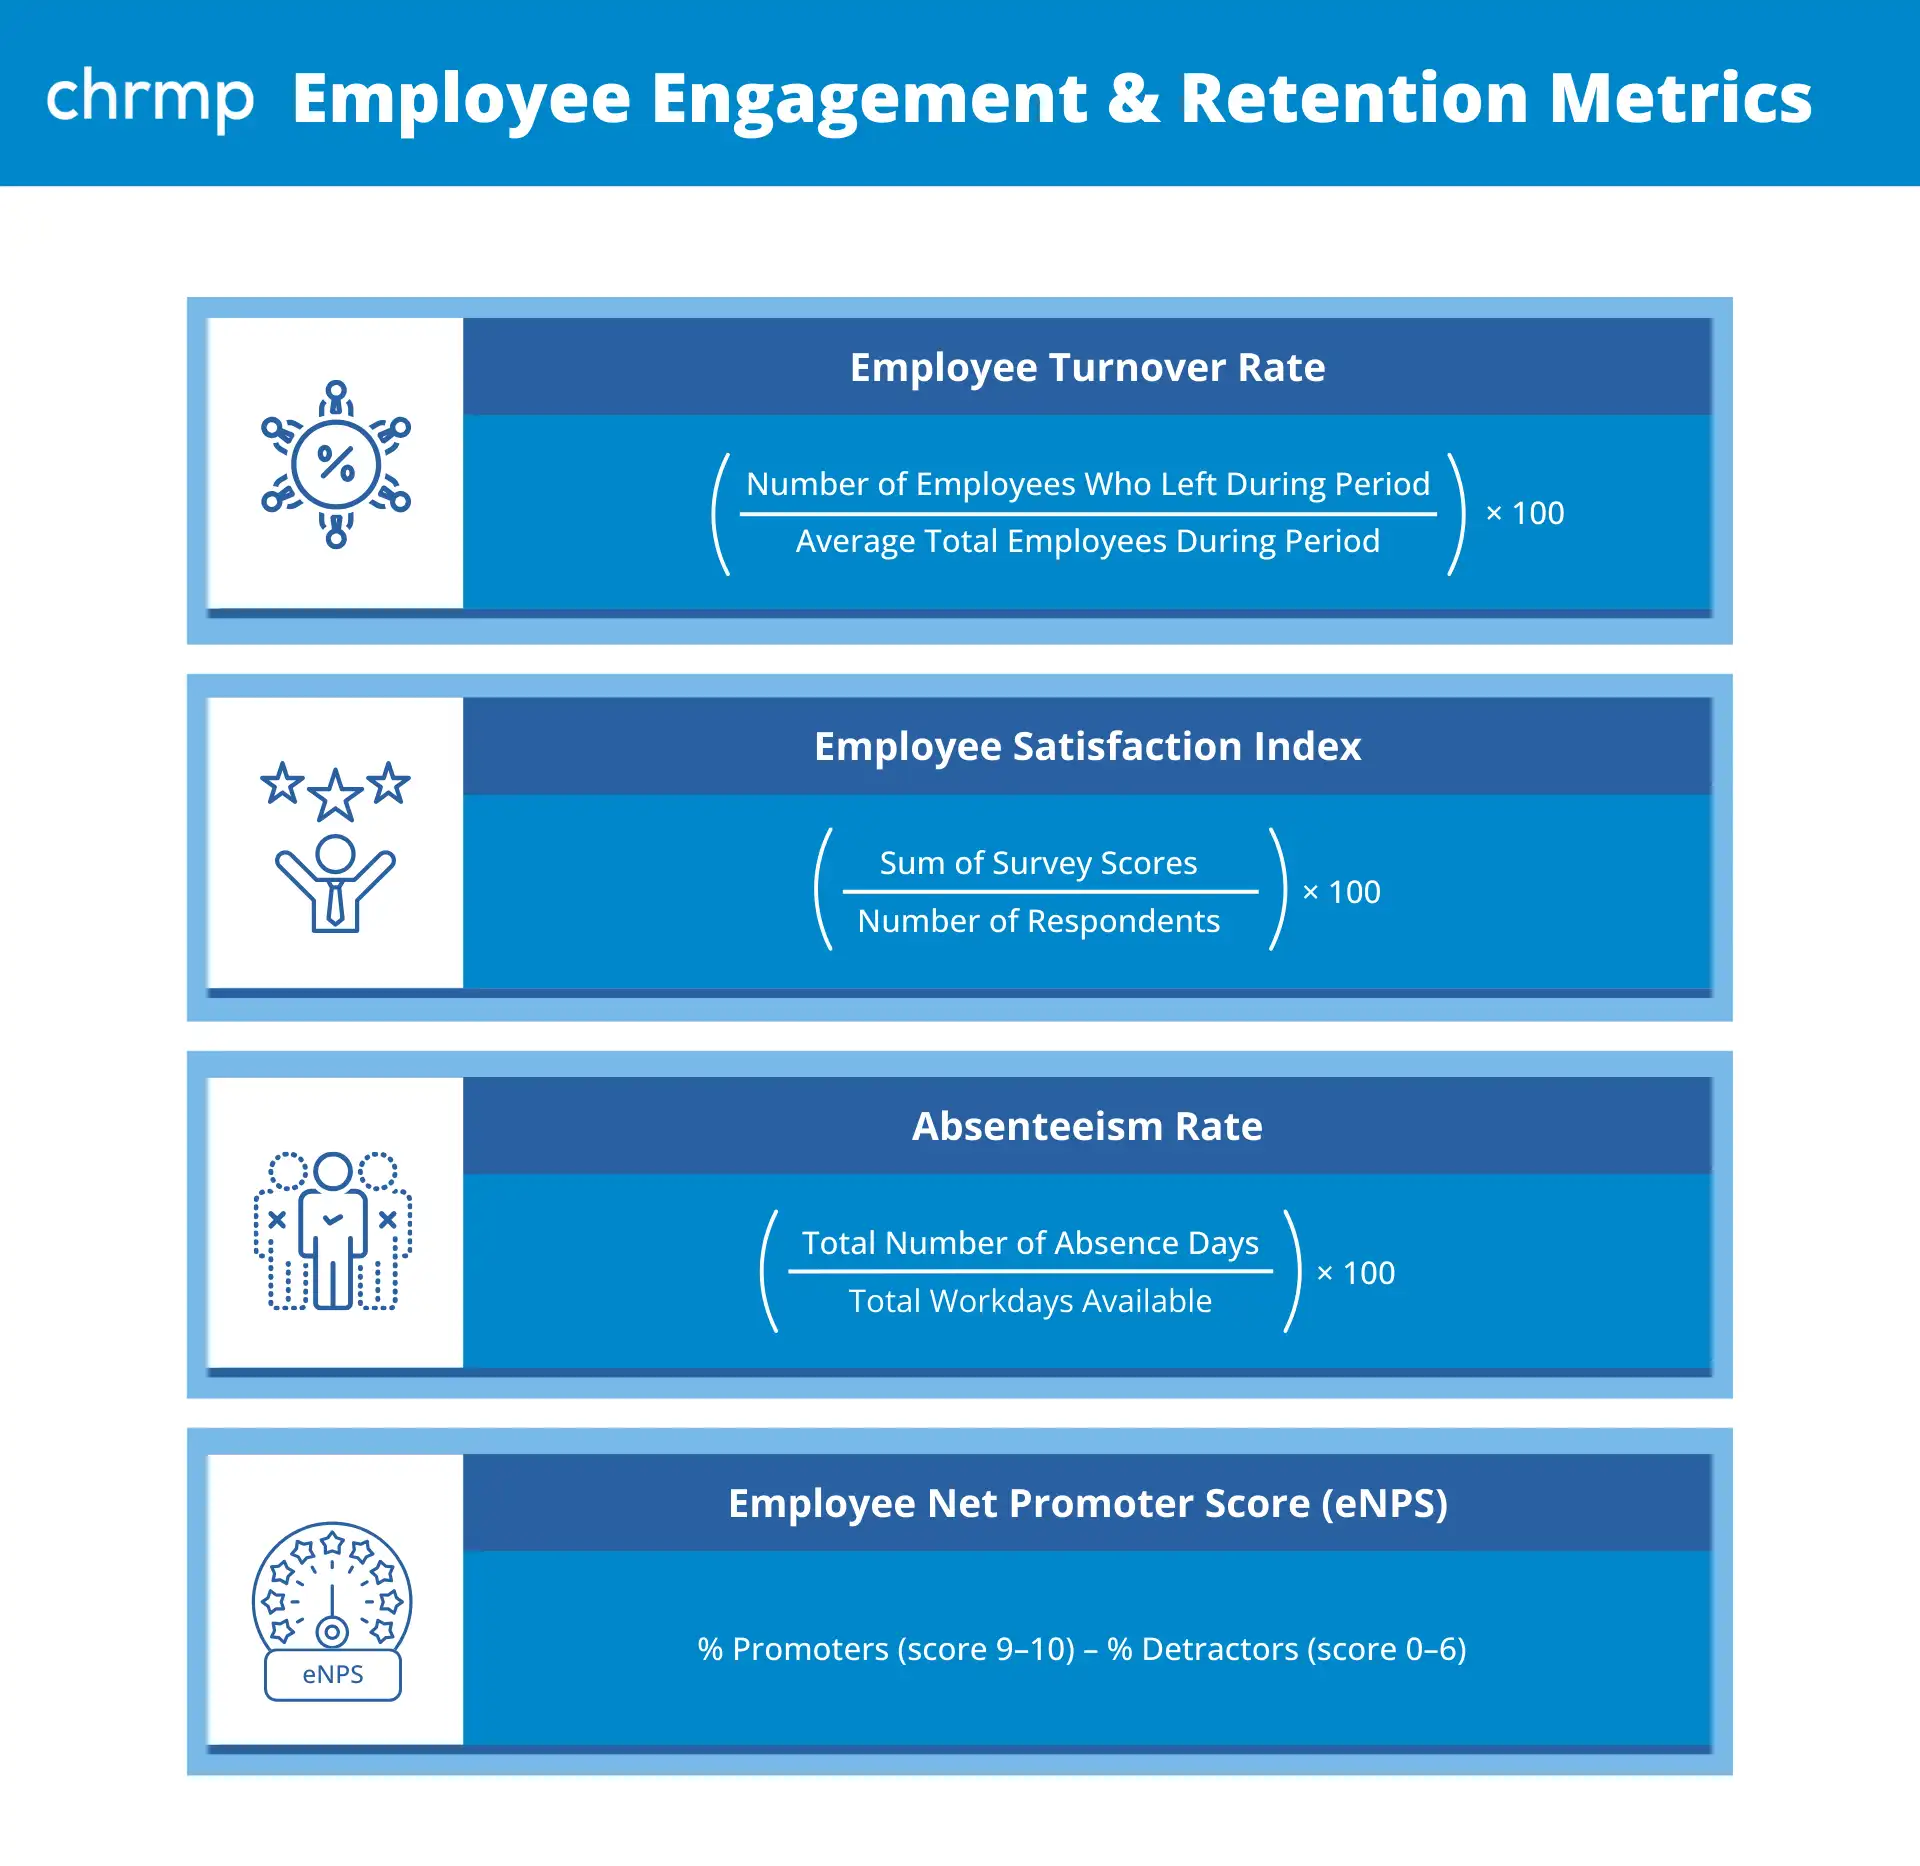
Turnover Rate (%) = (Number of Employees Who Left During Period / Average Total Employees During Period) × 100
Why It Matters:
A high turnover rate is often a red flag—it can suggest dissatisfaction, lack of growth opportunities, or cultural mismatches. It also leads to increased hiring costs and disruptions in team dynamics.
Example Use Case:
An HR team noticed that voluntary turnover was highest among new hires in their first 90 days. They revamped their onboarding experience, introduced mentoring, and reduced first-quarter turnover by 22%.
3.2 Employee Satisfaction Index
Definition:
A score derived from employee surveys measuring satisfaction with their role, team, leadership, and work environment.
Formula:
Satisfaction Index = (Sum of Survey Scores / Number of Respondents) × 100
Why It Matters:
Satisfied employees are not just happier—they’re more engaged, more productive, and more likely to stay. This index helps uncover how people truly feel about working at your company, especially when tracked over time.
Example Use Case:
A survey revealed that employees were least satisfied with internal communication. The HR team launched a company-wide communication strategy, and satisfaction scores improved in the next pulse survey.
3.3 Absenteeism Rate
Definition:
Tracks the percentage of unplanned absences among employees during a given time period.
Formula:
Absenteeism Rate = (Total Number of Absence Days / Total Workdays Available) × 100
Why It Matters:
While everyone needs time off, a consistently high absenteeism rate may indicate burnout, low morale, or health issues within teams. Addressing the root causes early can prevent bigger cultural and performance issues.
Example Use Case:
A support team experienced high absenteeism during peak seasons. HR introduced flexible shift swaps and mental health days, leading to a 30% drop in unplanned absences.
3.4 Employee Net Promoter Score (eNPS)
Definition:
Measures employee loyalty and likelihood to recommend the organization as a great place to work.
Formula:
eNPS = % Promoters (score 9–10) – % Detractors (score 0–6)
Why It Matters:
eNPS is a simple yet powerful tool to gauge overall employee sentiment. It acts as a pulse check for how connected and motivated your workforce feels. A low eNPS can signal deeper engagement issues.
How to Use It:
Example Use Case:
After eNPS dipped below +10, a company ran deep-dive sessions with employees and discovered that recognition was lacking. They introduced a peer-to-peer appreciation program, and the next eNPS rose to +32.
Final Thoughts on Engagement and Retention Metrics
People don’t just leave jobs—they leave cultures, managers, and missed opportunities. By consistently measuring engagement and retention, HR can create environments where people thrive. These metrics are more than numbers—they’re early warnings and long-term success indicators.
Ever heard the phrase, “People don’t leave jobs, they leave managers”? That’s true—but let’s not ignore another massive factor: compensation and benefits.
People want to feel fairly compensated—not just in terms of salary, but in total value. When employees feel underpaid or undervalued, their engagement drops, and the job market starts looking awfully tempting. On the flip side, competitive pay and meaningful benefits boost retention, satisfaction, and even employer brand.
This is why compensation and benefits metrics aren’t just for payroll specialists—they’re a core part of your people strategy. Let’s break down the three that matter most:
4.1 Compensation Ratio (a.k.a. Compa-Ratio)
What it is:
This ratio compares an employee’s current salary to the market rate or the company’s internal pay range midpoint for that role.
Formula:
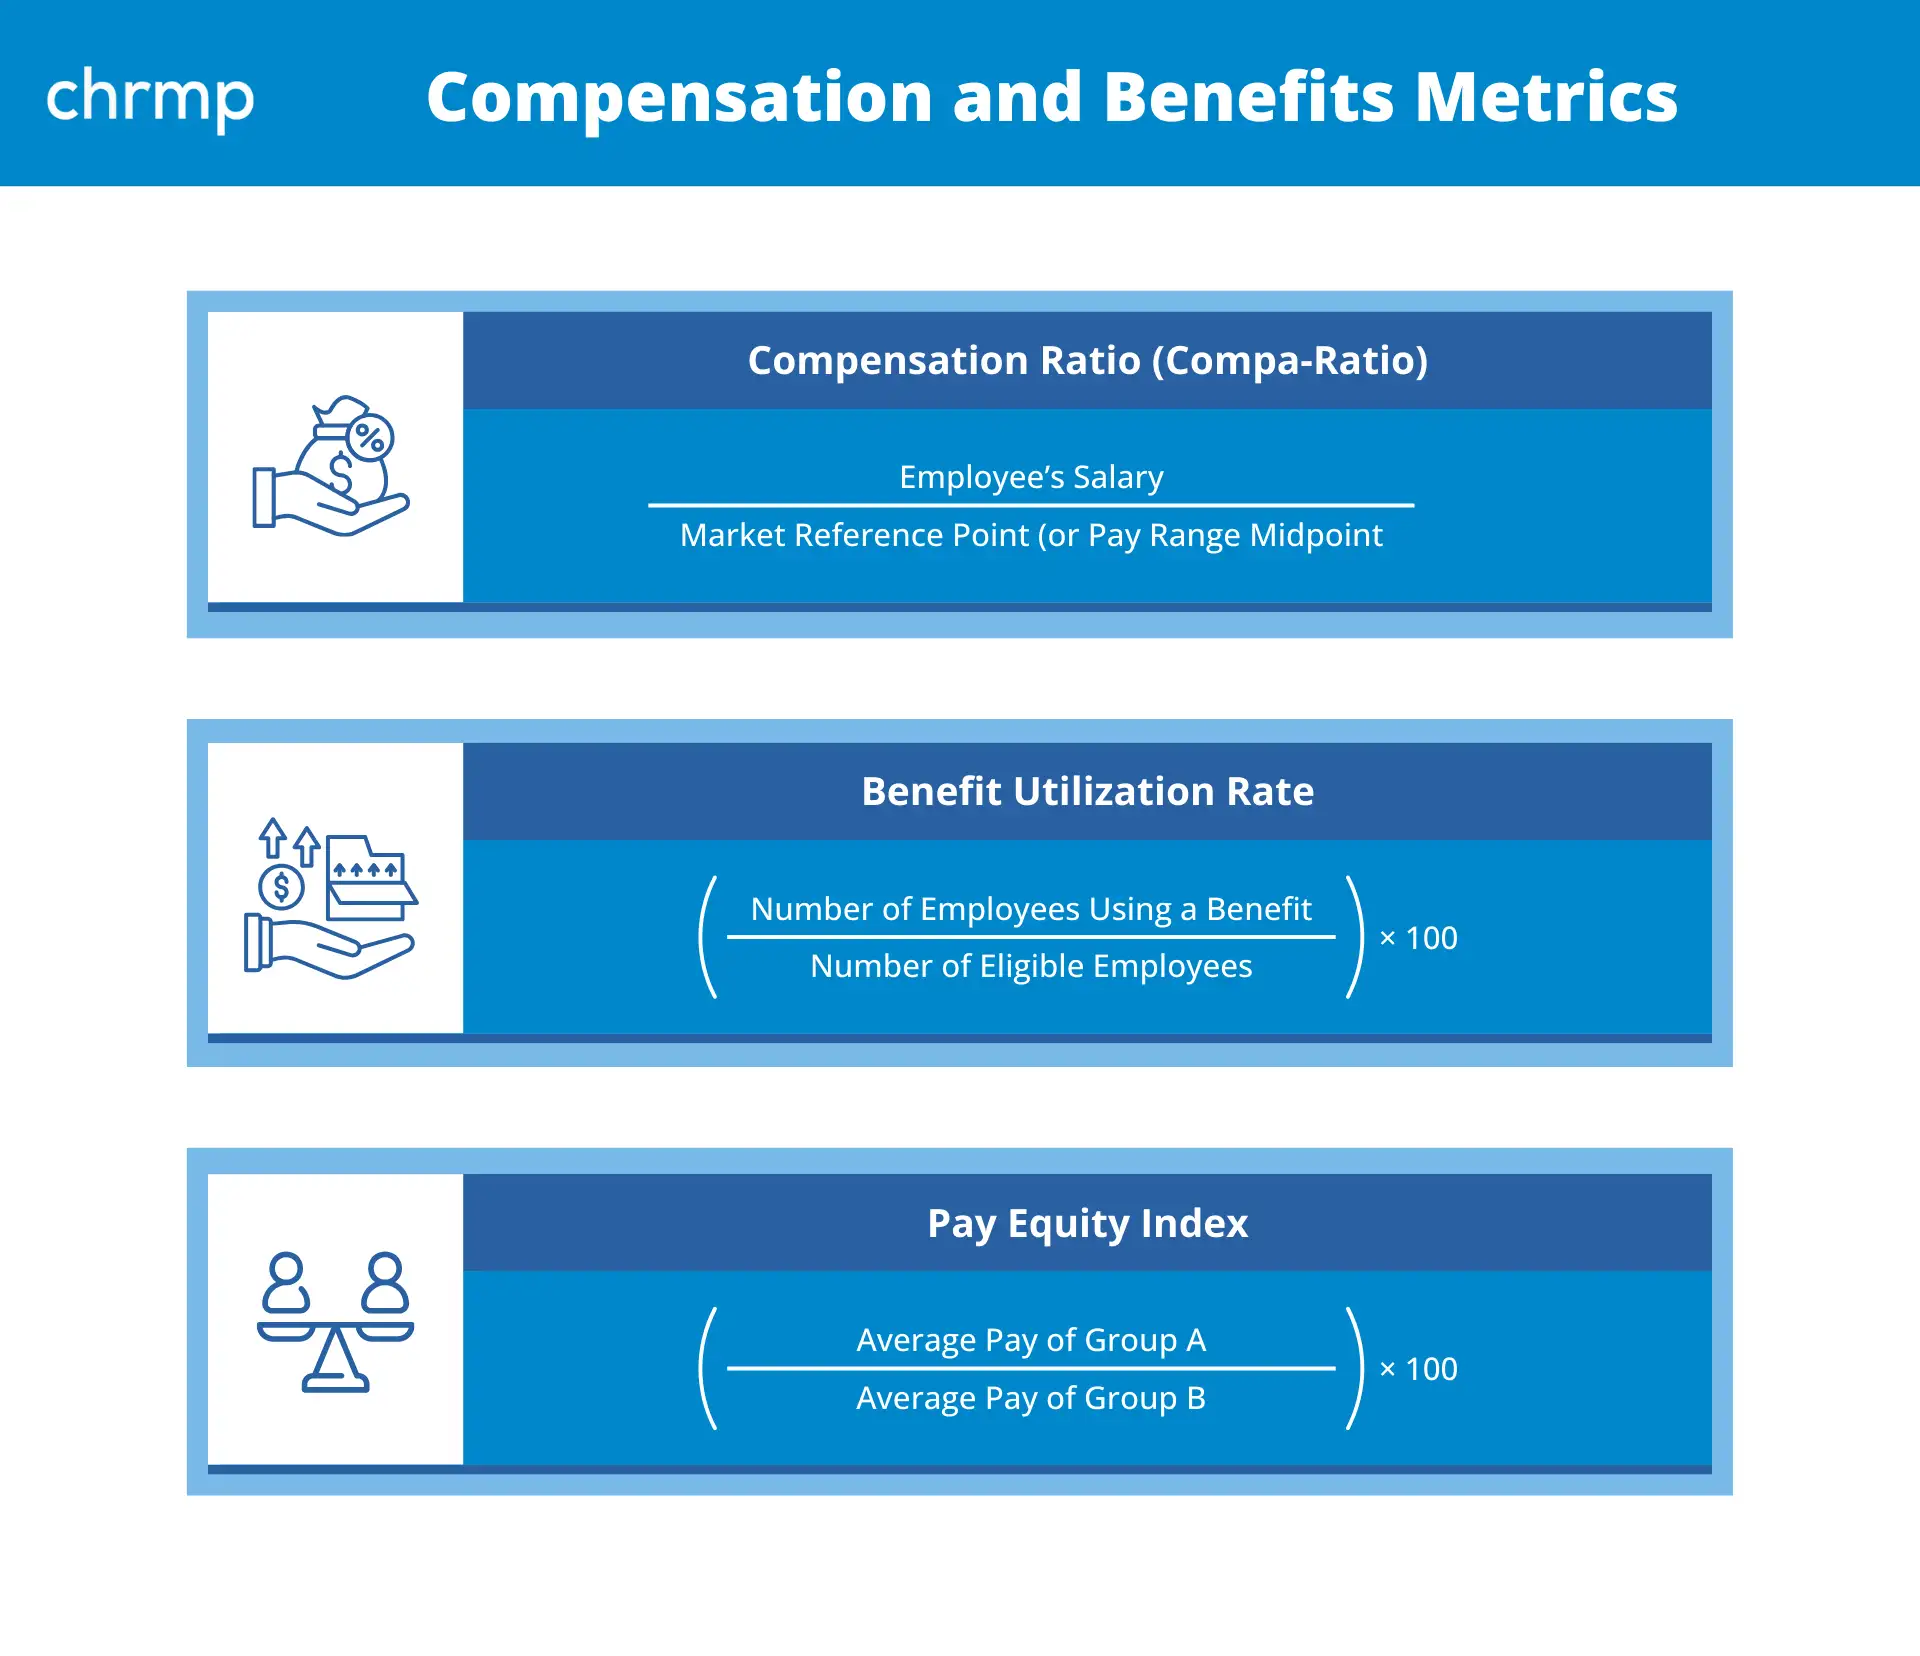
Compensation Ratio = Employee’s Salary / Market Reference Point (or Pay Range Midpoint)
Why it matters:
It’s a fast, clear way to see if someone is underpaid, fairly paid, or even overpaid based on benchmarks. This is crucial for equity, transparency, and preventing unintended attrition.
Real-life scenario:
Let’s say your average compa-ratio for engineers is 0.85 (or 85%). That means they’re earning 15% less than the market standard. That’s a red flag—especially if your competitors are paying market rate or higher. Time to revisit your compensation strategy.
4.2 Benefit Utilization Rate
What it is:
This measures how many employees are actually using the benefits you offer.
Formula:
Benefit Utilization Rate = (Number of Employees Using a Benefit / Number of Eligible Employees) × 100
Why it matters:
Offering great benefits is one thing. Knowing whether people use them is another. Low utilization might mean the benefits aren’t relevant, well-communicated, or easy to access. High utilization shows you’re hitting the mark.
Use case:
A company offers mental health counseling but only 8% of employees use it. After a pulse survey, HR learns most employees didn’t know it existed. They relaunch the benefit with clear info sessions and manager endorsement—utilization jumps to 40% within a quarter.
4.3 Pay Equity Index
What it is:
This index highlights potential pay disparities between different groups (e.g., gender, race, job levels).
Formula:
Pay Equity Index (%) = (Average Pay of Group A / Average Pay of Group B) × 100
Why it matters:
Pay gaps—intentional or not—can erode trust and lead to legal and reputational risks. Tracking and addressing these proactively sends a strong message about fairness and inclusion.
Example insight:
An organization runs a pay equity audit and discovers that, on average, women in similar roles are earning 93% of what their male counterparts earn. Leadership commits to closing this gap over two compensation cycles, increasing transparency and employee confidence.
Wrapping Up This Section
Fair compensation and thoughtful benefits don’t just make people stay—they make them feel seen and respected. By using these metrics, HR teams can ensure their pay structures align with market trends, reflect internal equity, and support overall employee wellbeing.
In today’s workforce, fostering a diverse, equitable, and inclusive workplace is not just a value-driven initiative—it is a strategic business imperative. Organizations that prioritize DEI experience stronger innovation, improved decision-making, and greater employee satisfaction.
To effectively drive and measure progress in DEI efforts, HR departments must rely on specific, actionable metrics. These metrics provide visibility into how inclusive an organization truly is and identify where systemic barriers may exist.
Below are the key DEI metrics that every forward-thinking HR team should monitor:
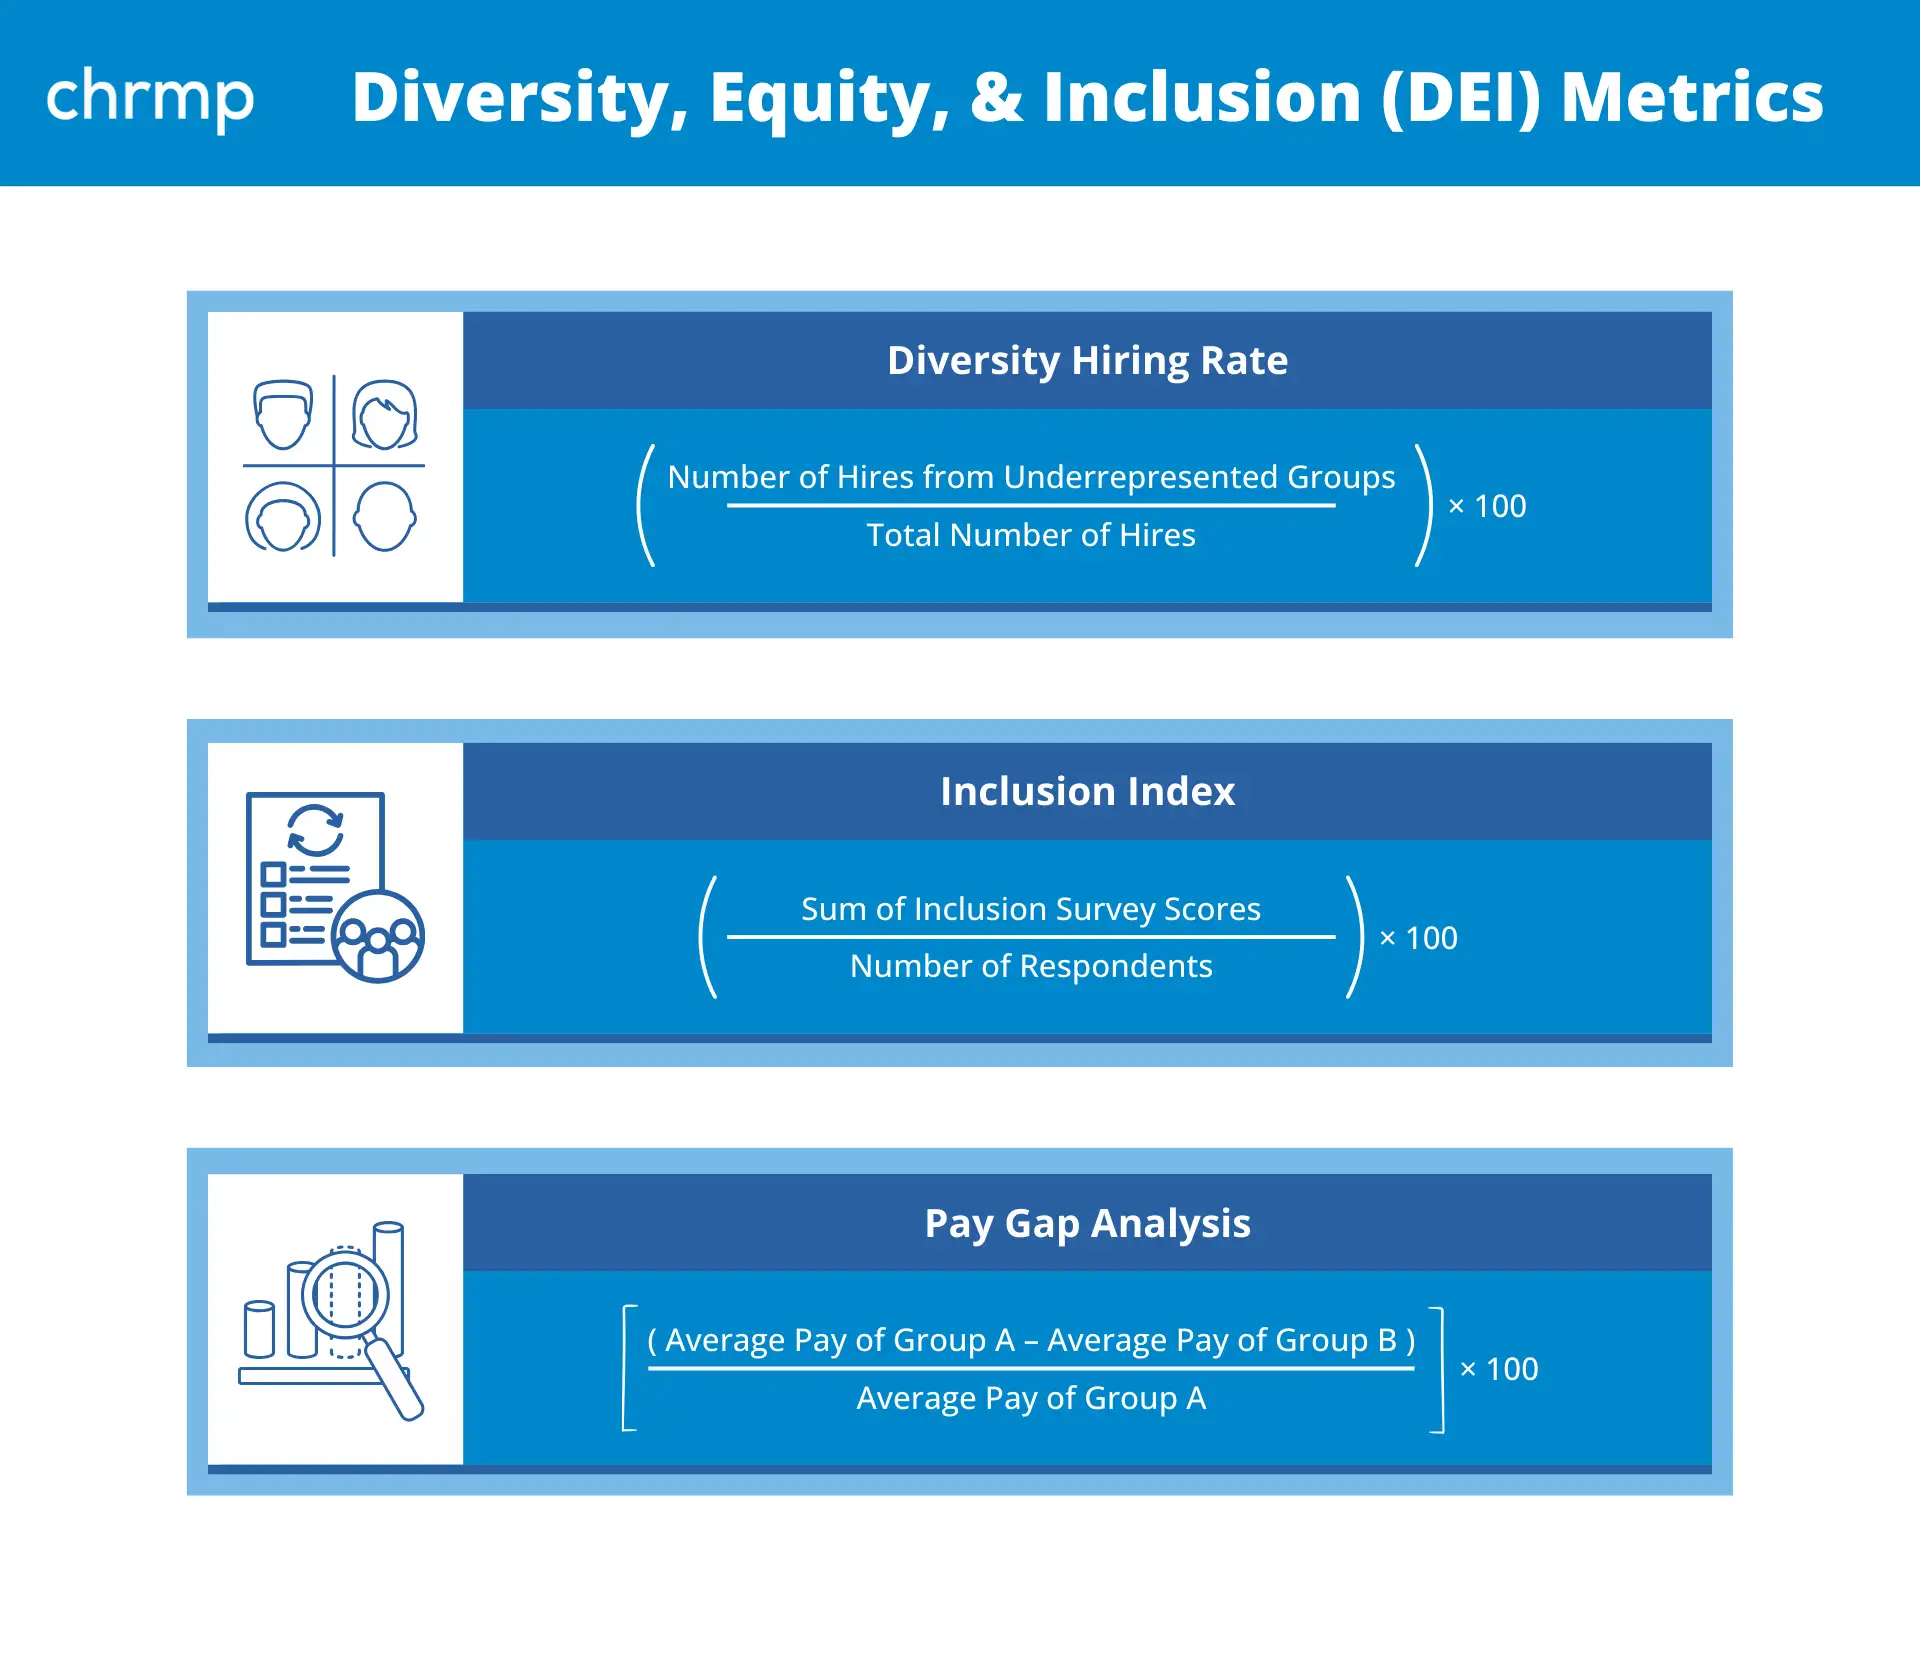
5.1 Diversity Hiring Rate
Definition:
The percentage of hires made from underrepresented groups within a specific time period.
Formula:
Diversity Hiring Rate = (Number of Hires from Underrepresented Groups / Total Number of Hires) × 100
Purpose and Use:
This metric assesses how effective an organization is in attracting and recruiting diverse candidates. It is especially useful in tracking progress against diversity goals and identifying potential biases in hiring practices.
Application Example:
An organization seeking to improve gender diversity in its tech division sets a goal to increase the hiring of women software engineers by 20%. By tracking this metric quarterly, the HR team is able to adjust sourcing strategies and achieve a measurable improvement.
5.2 Inclusion Index
Definition:
A composite score derived from employee surveys measuring perceptions of belonging, fairness, and respect in the workplace.
Formula:
Inclusion Index = (Sum of Inclusion Survey Scores / Number of Respondents) × 100
Purpose and Use:
Unlike diversity, which can be quantified, inclusion focuses on employee perception. This metric provides insights into whether employees feel welcomed, heard, and respected, regardless of their background.
Application Example:
A company introduces an annual inclusion survey with questions such as “I feel safe sharing my opinions at work” and “I believe people like me can succeed here.” After analyzing the results, the HR team implements tailored training programs to address identified gaps.
5.3 Pay Gap Analysis
Definition:
A measure of average differences in compensation between different demographic groups, such as gender or ethnicity.
Formula:
Pay Gap (%) = [(Average Pay of Group A – Average Pay of Group B) / Average Pay of Group A] × 100
Purpose and Use:
This metric identifies inequalities in pay that may not be visible on a surface level. Addressing pay gaps supports organizational commitments to fairness and compliance with pay equity laws.
Application Example:
Following a comprehensive compensation audit, a company identifies a 7% average pay gap between male and female employees in managerial roles. As a result, leadership implements salary adjustments and adopts standardized compensation frameworks to promote equity.
Final Note on DEI Metrics
Monitoring DEI metrics provides HR leaders with the data required to make informed, equitable decisions. These metrics go beyond compliance—they are essential for building a culture where diverse talent can thrive. By embedding DEI into everyday practices and continuously tracking progress, organizations can ensure that their commitment to equity and inclusion is not only aspirational but actionable.
Employee health and safety are foundational to a productive and sustainable workplace. Beyond compliance with legal and regulatory standards, prioritizing health and safety reflects an organization’s commitment to employee wellbeing. Monitoring these metrics helps HR and leadership teams identify risks, reduce accidents, promote wellness, and foster a supportive work environment.
Workplace Health and Safety (WHS) metrics are particularly important in industries with physical labor, machinery, or environmental exposure, but they are increasingly relevant across all sectors, including corporate offices—especially in the context of mental health, hybrid work, and burnout.
Below are the three essential WHS metrics every organization should track:
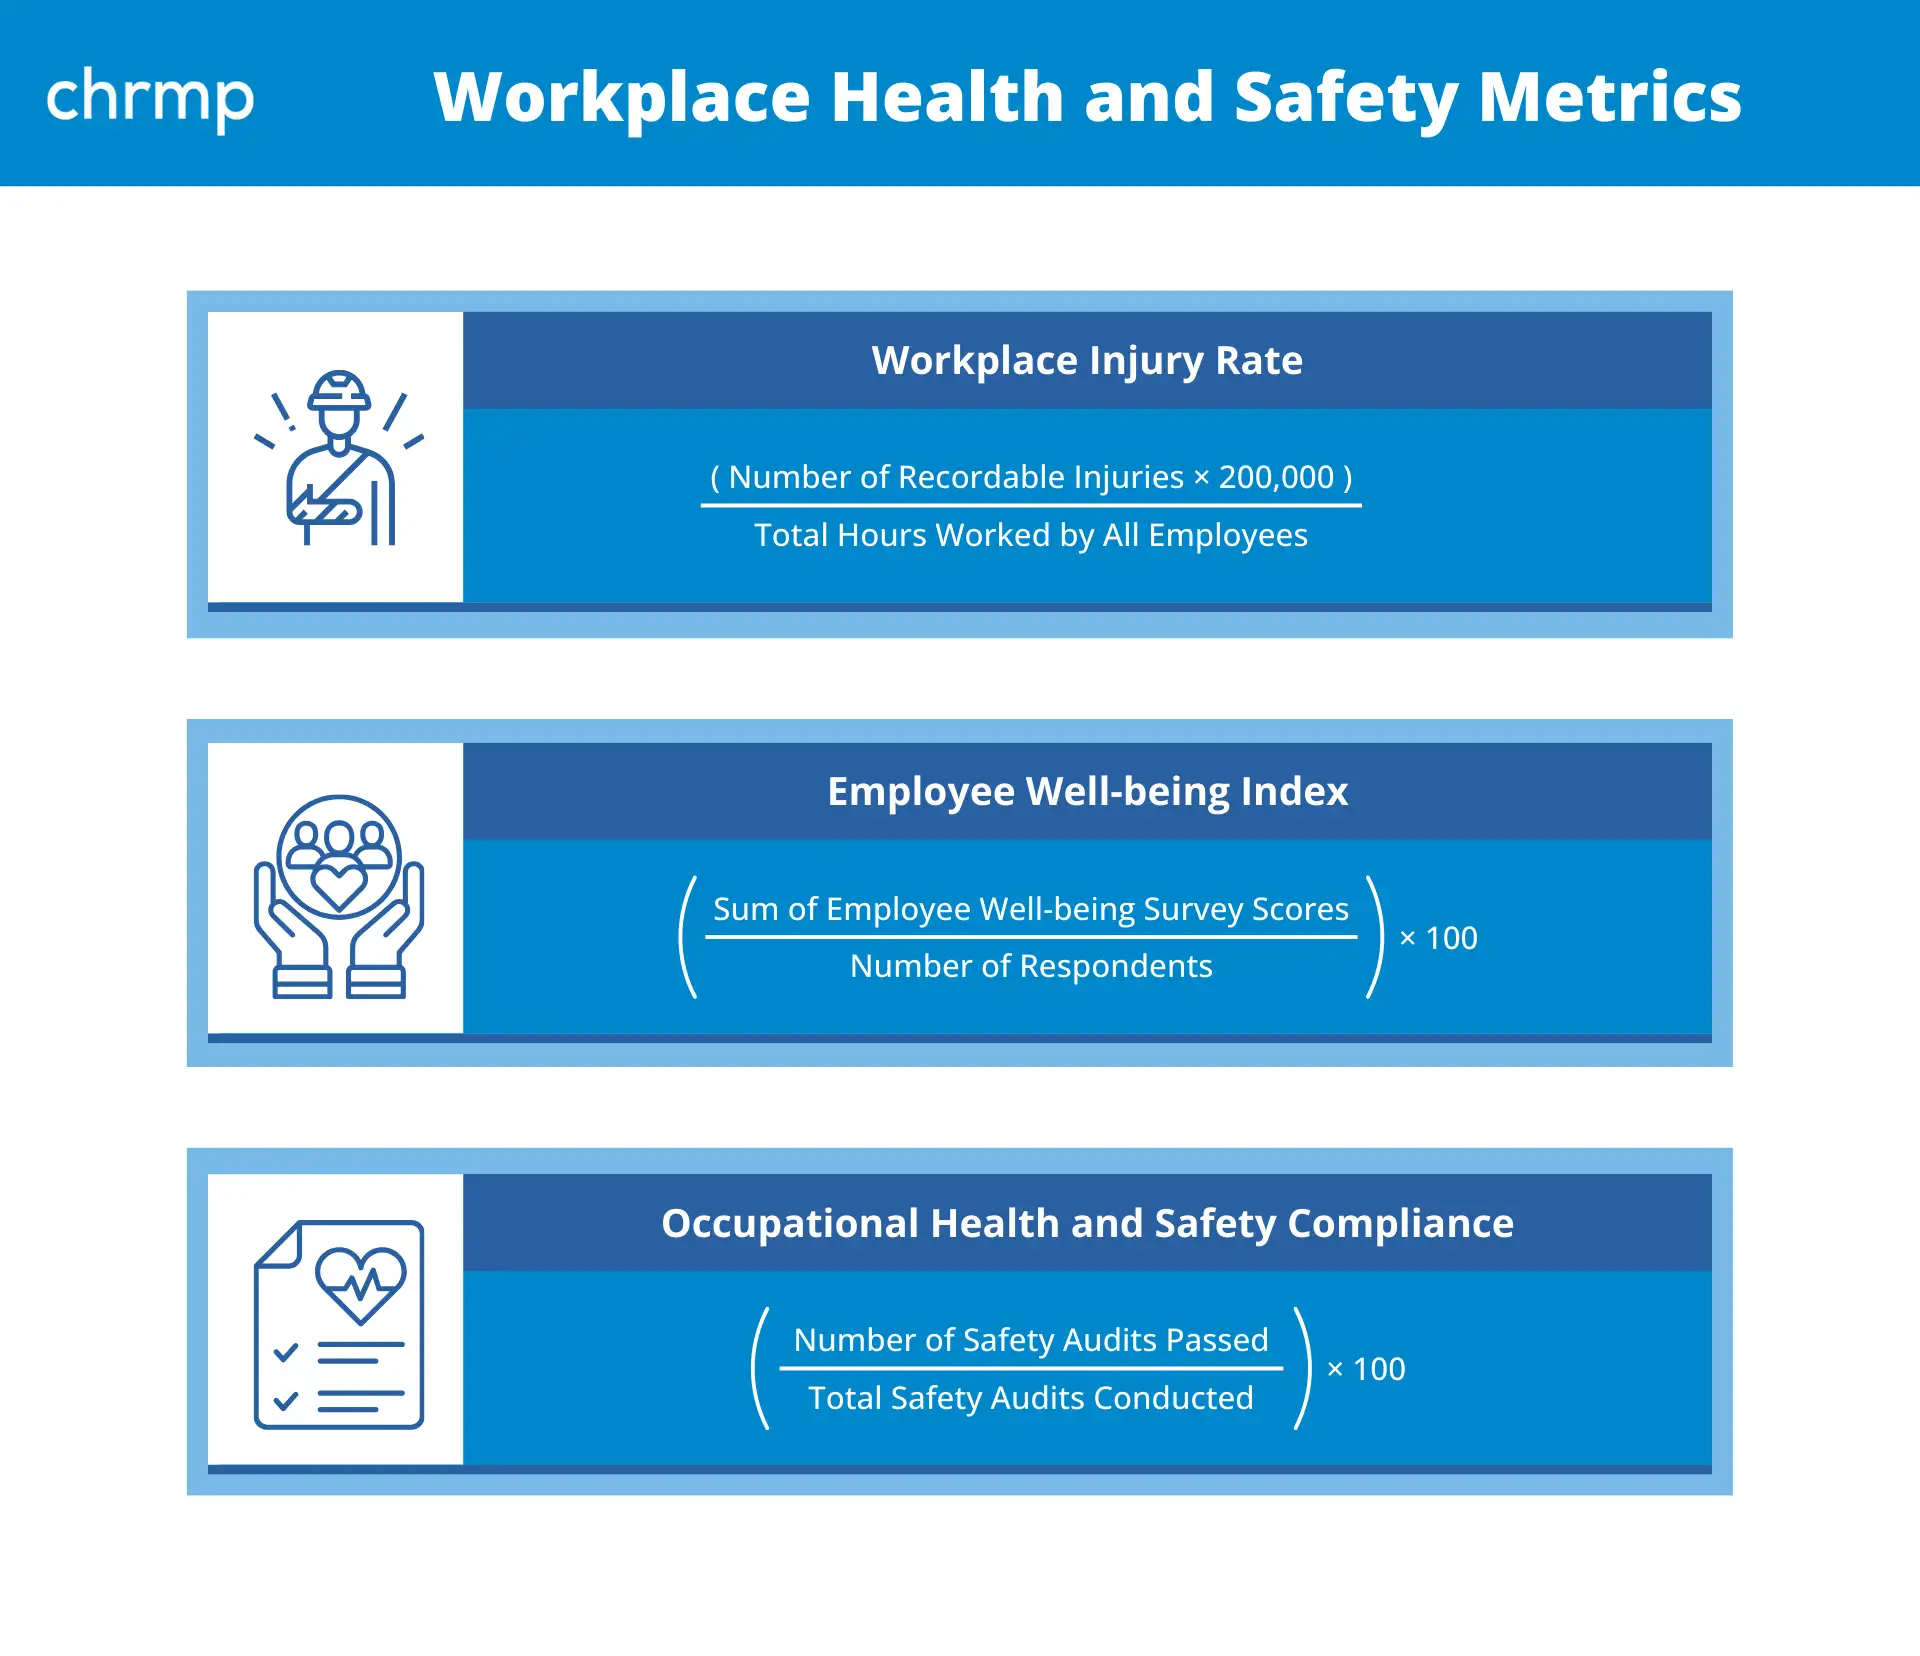
6.1 Workplace Injury Rate
Definition:
Measures the number of recordable injuries or illnesses that occur in the workplace per 100 full-time employees over a defined period.
Formula:
Workplace Injury Rate = (Number of Recordable Injuries × 200,000) / Total Hours Worked by All Employees
Purpose and Use:
This metric helps organizations monitor the frequency and severity of workplace incidents. A high rate can indicate underlying safety hazards, inadequate training, or gaps in safety protocols.
Application Example:
A manufacturing company observes a spike in injury rates during night shifts. After reviewing the data, it enhances safety briefings, upgrades protective equipment, and increases supervisory oversight, resulting in a 40% reduction in incidents over the next quarter.
6.2 Employee Well-being Index
Definition:
A composite score derived from survey responses measuring physical health, mental wellness, stress levels, and access to wellness resources.
Formula:
Well-being Index = (Sum of Employee Well-being Survey Scores / Number of Respondents) × 100
Purpose and Use:
This index offers a holistic view of how employees feel about their health and workplace support systems. It helps identify burnout risk, morale dips, and engagement issues related to workload or stress.
Application Example:
A professional services firm with high turnover and absenteeism implements quarterly well-being surveys. The results highlight high stress among mid-level managers. The company introduces mindfulness programs and flexible work options, which boost well-being scores and reduce sick leave usage.
6.3 Occupational Health and Safety Compliance
Definition:
Tracks adherence to regulatory health and safety requirements and internal safety policies.
Formula:
Compliance Rate (%) = (Number of Safety Audits Passed / Total Safety Audits Conducted) × 100
Purpose and Use:
Compliance metrics ensure the organization is meeting legal obligations and best practice standards in occupational health and safety. Regular tracking supports proactive risk management and minimizes liability.
Application Example:
During an annual compliance audit, a logistics company discovers gaps in fire drill protocols at several warehouses. After conducting refresher training and updating safety signage, they achieve 100% compliance in the following quarter.
Wrap up for Workplace Health & Safety Metrics
Workplace health and safety metrics are no longer optional—they are vital indicators of employee welfare, organizational responsibility, and long-term sustainability. By consistently monitoring and acting on these metrics, HR can help create a work environment where employees feel secure, supported, and valued.
Each category of HR metrics serves a critical role in understanding and enhancing how people interact with your organization—from their first interview to their long-term career trajectory. By using these metrics holistically, HR professionals can not only diagnose challenges but also design high-impact strategies that improve productivity, morale, diversity, and overall organizational health. The right metrics don’t just measure success—they drive it.
In today’s data-centric business environment, effectively tracking and analyzing Human Resources (HR) metrics is crucial for informed decision-making. By leveraging appropriate tools and methodologies, organizations can transform raw data into actionable insights, driving strategic initiatives and fostering a culture of continuous improvement.
Common Software and Tools for Tracking HR Metrics
Selecting the right tools is foundational to a successful HR analytics strategy. Here are some prominent categories and examples:
People Analytics Tools: Advanced platforms like Visier and Tableau offer in-depth data analysis and visualization capabilities, enabling predictive analytics and strategic workforce planning.
Collecting HR metrics is only the first step. The real power of HR analytics lies in how data is interpreted and used to inform business strategy. To truly unlock the value of HR metrics, HR professionals must follow proven best practices that ensure reliability, relevance, and actionable insights.
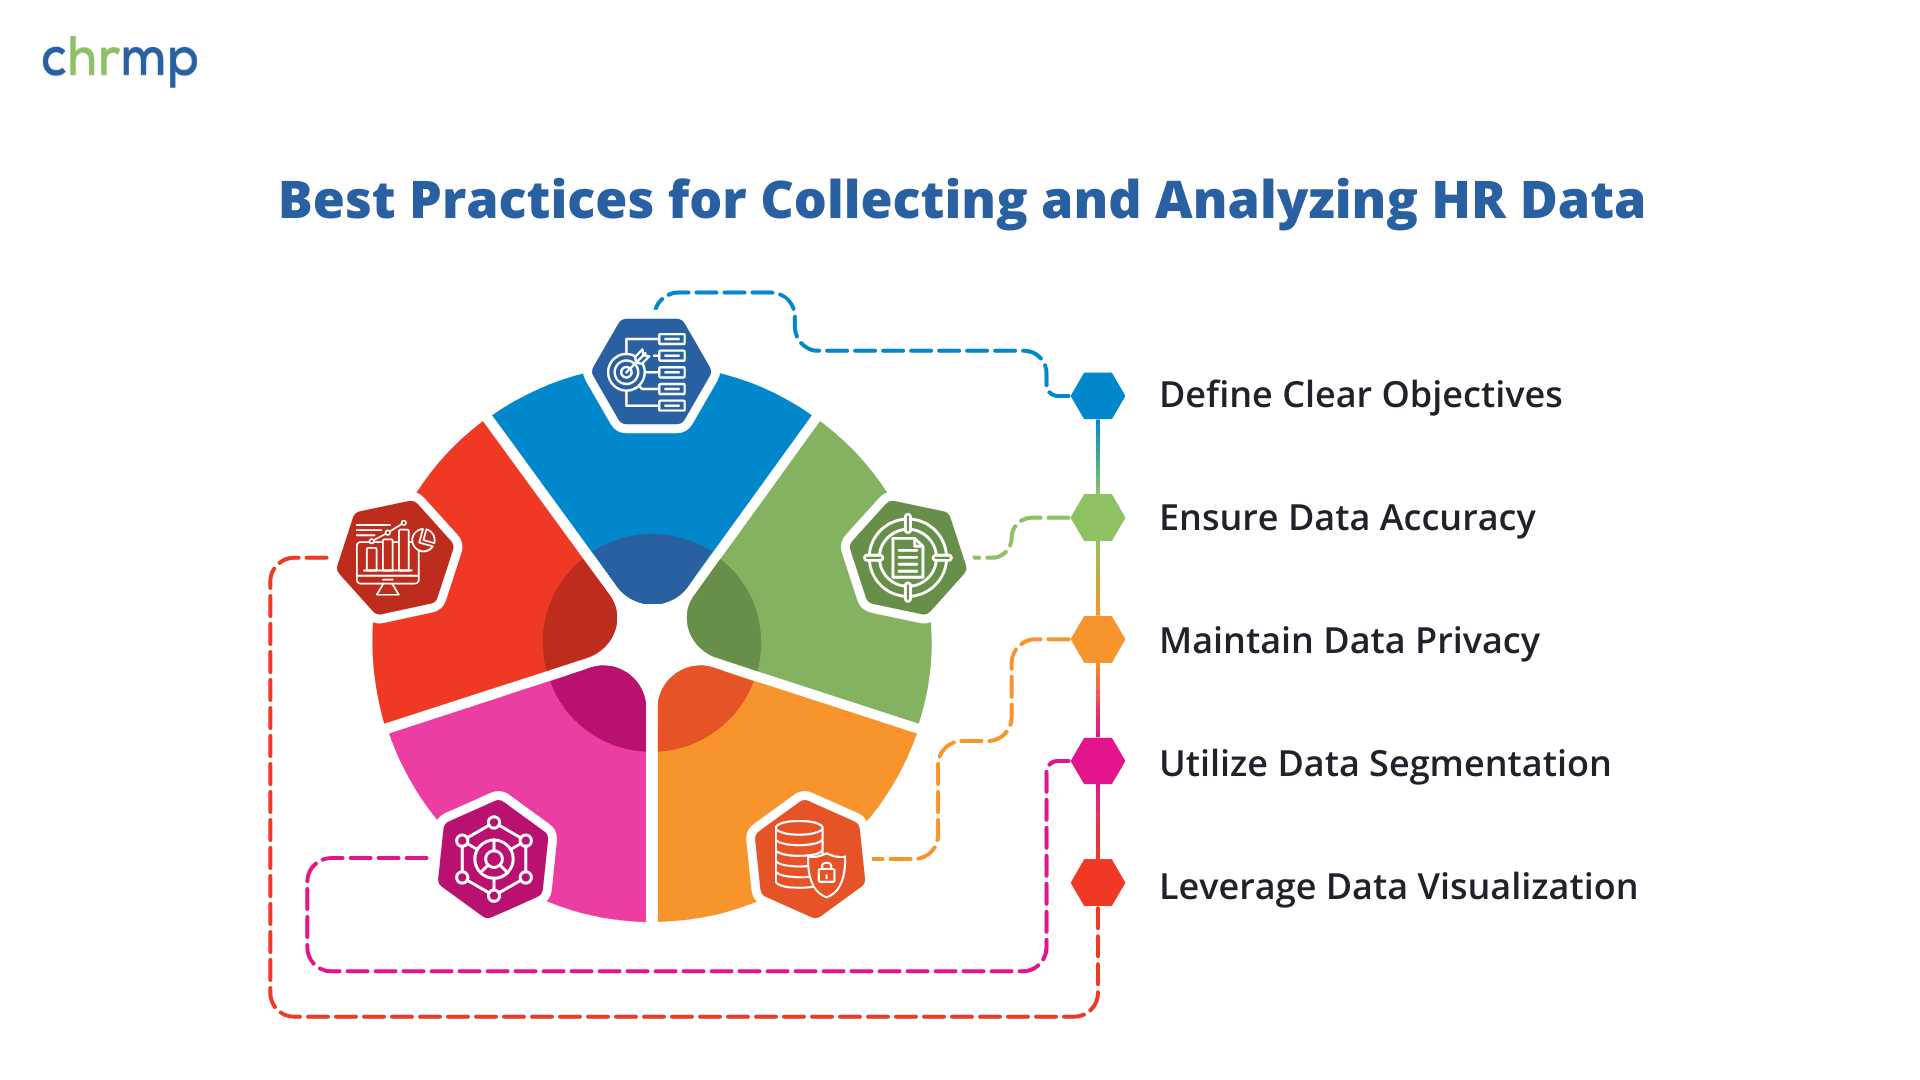
Here are five essential practices to guide successful data collection and analysis in HR:
1. Define Clear Objectives
Before collecting any data, it’s critical to clarify what you’re measuring and why. HR teams should align every data point with a broader business goal or HR initiative. For example, if the objective is to reduce employee turnover, metrics like exit interview insights, engagement scores, and managerial feedback should be prioritized.
Why it matters: Without a clear objective, HR teams risk collecting irrelevant data, leading to analysis paralysis or misinformed strategies. Defining objectives ensures focus and better alignment between HR efforts and organizational outcomes.
2. Ensure Data Accuracy
Garbage in, garbage out. The quality of your HR insights depends heavily on the accuracy of your data inputs. This means ensuring that data entry is consistent across platforms, that systems are updated regularly, and that duplicate or outdated records are identified and removed.
How to achieve it:
Real-world impact: Inaccurate absenteeism data, for instance, might falsely indicate poor employee engagement, leading to unnecessary interventions.
3. Maintain Data Privacy
With sensitive employee information at stake, maintaining data privacy isn’t optional—it’s mandatory. Organizations must comply with legal frameworks like the General Data Protection Regulation (GDPR), and ensure ethical handling of personal data.
Best practices include:
Why it matters: Trust is the cornerstone of employee engagement. Mishandling personal data can not only damage trust but also expose the organization to reputational and legal risks.
4. Utilize Data Segmentation
One-size-fits-all analysis can lead to misleading conclusions. By segmenting data by variables such as department, location, job level, gender, tenure, or performance level, HR professionals gain a more nuanced understanding of workforce trends.
Example: An overall employee engagement score might seem healthy at 75%, but segmentation might reveal that frontline workers in a specific region are only at 52%, pointing to local leadership or operational issues.
Benefits:
5. Leverage Data Visualization
Data, no matter how insightful, is ineffective if it can’t be communicated clearly. Data visualization tools like dashboards, charts, and heatmaps help bring clarity to complex datasets and make them understandable for non-technical stakeholders.
Tool recommendations: Tableau, Power BI, or the built-in dashboards in HR platforms like BambooHR or SAP SuccessFactors.
Outcome: By visualizing trends—such as rising attrition in specific teams or improved engagement after training—HR teams can more effectively tell stories that inspire action and drive leadership buy-in.
Analyzing HR data effectively requires a thoughtful, ethical, and structured approach. When these best practices are followed, data becomes more than just numbers—it becomes a strategic asset, enabling HR teams to anticipate challenges, measure impact, and deliver real business value.
HR metrics are powerful tools—but like any strategic resource, they come with their own set of hurdles. While these metrics can help uncover patterns and guide informed decision-making, they’re only as effective as the data, systems, and culture that support them.
Below are two common challenges that HR professionals face when implementing or expanding their use of HR metrics—and how to overcome them:
The challenge:
One of the most prevalent barriers in using HR metrics effectively is data quality. Incomplete, outdated, or inconsistent data can distort insights and lead to poor decision-making. For instance, if employee absenteeism is recorded inconsistently across departments, it may paint a false picture of productivity or engagement. Similarly, if training completion data is not updated in real time, it could skew your evaluation of learning and development effectiveness.
Why it matters:
HR decisions based on flawed data can have serious implications. It may lead to misguided investments, overlooked problem areas, or ineffective HR interventions. Worse, it can erode leadership trust in HR analytics altogether.
The solution:
Pro Tip: Even with advanced HR technology, regular human oversight is key. Periodic internal data reviews can help spot anomalies before they impact business decisions.
The challenge:
Despite the growing availability of tools and insights, many organizations still rely heavily on instinct, experience, or legacy practices when making HR decisions. This resistance to a data-driven approach can stem from a variety of reasons—lack of data literacy among HR managers, fear of change, or skepticism around data reliability.
Why it matters:
Without cultural buy-in from leadership and HR teams, even the most sophisticated analytics tools will sit unused or underutilized. Moreover, resistance can limit the ability of HR to proactively identify issues, measure progress, or justify new initiatives with evidence.
The solution:
Example: A company reluctant to use engagement metrics saw improved buy-in after HR leaders presented an interactive dashboard that linked declining eNPS scores with increased attrition in a particular business unit. The visual connection prompted immediate action from department heads.
While challenges in data accuracy and cultural resistance are real, they are also surmountable. By establishing strong data governance, encouraging collaboration across departments, and building a data-driven mindset from the top down, HR professionals can fully harness the strategic value of metrics.
In any organization, the effectiveness of HR analytics doesn’t just depend on systems or data—it hinges on leadership. The role of HR leaders, as well as senior management, is critical in weaving HR metrics into the strategic fabric of the business. When leaders champion a data-driven approach, HR metrics shift from being reactive reports to proactive tools for transformation.
How Leaders Can Leverage HR Data for Strategic Workforce Planning
Strategic workforce planning requires foresight, agility, and evidence-based decision-making. Leaders equipped with HR data can anticipate future needs and design better people strategies. Here’s how:
✅ Identify Talent Gaps Before They Widen
Workforce analytics can help leaders spot upcoming shortages in skills or roles. For example, analyzing succession data might reveal that 40% of mid-level managers are likely to retire within five years—indicating an urgent need to train emerging leaders. Similarly, monitoring internal mobility and learning adoption can help identify underutilized talent and bridge skill gaps.
Why it matters: Proactively addressing gaps reduces hiring costs, improves retention, and minimizes disruption to critical business functions.
✅ Enhance Employee Development Through Personalized Learning Paths
Leaders can use performance appraisal trends, feedback scores, and training completion rates to create targeted learning and development (L&D) programs. For example, if data shows that high-performing employees consistently lack exposure to cross-functional projects, L&D can design rotational assignments that build leadership competencies.
Why it matters: This data-informed approach not only supports employee growth but aligns development programs with future business needs—maximizing ROI and engagement.
The level of leadership involvement can make or break the success of HR analytics. When executives view HR metrics as a strategic priority, the organization moves from simply measuring people to managing them effectively.
📈 Increased Resource Allocation
Leaders who believe in the power of data are more likely to fund necessary tools, platforms, and roles such as HR data analysts or people scientists. With dedicated budgets and resources, HR teams can automate reporting, implement dashboards, and dig deeper into workforce trends—ultimately driving better outcomes.
Example: Many leading organizations have established HR analytics centers of excellence, often at the behest of executive teams that recognize the business value of advanced talent insights.
🌐 Enhanced Data-Driven Culture
When leaders model data-driven thinking—using HR dashboards in leadership meetings, referencing engagement scores during performance discussions, or basing DEI decisions on actual hiring data—it sends a powerful message. It encourages managers across the business to make similar use of data in their decision-making.
Why it matters: A data-driven culture fosters transparency, objectivity, and continuous improvement. Over time, it shifts organizational thinking from “What do we feel?” to “What does the data tell us—and how do we act on it?”
Leadership isn’t just a stakeholder in HR analytics—it’s the engine. When senior leaders not only endorse but actively participate in data-driven HR management, it elevates the credibility, impact, and reach of every HR initiative. The result is a more agile, insight-driven organization where workforce strategy is not just reactive, but predictive and proactive.
HR metrics aren’t just theoretical—they can be the key to unlocking measurable business success. When HR teams use data to drive decisions, they gain clarity on what’s working, what’s not, and where to act. Let’s explore how organizations across different industries have harnessed HR analytics to improve their operations and workforce outcomes.
📍Scenario:
A large retail chain was experiencing unusually high attrition among its frontline store employees. With frequent resignations, increasing recruitment costs, and operational disruptions, leadership turned to HR for answers.
🔍Action Taken:
HR implemented a data-driven review of exit interviews, engagement surveys, and manager feedback. They discovered a recurring theme: a lack of visible career advancement opportunities was demotivating employees. Many felt “stuck” in their roles without clear growth paths.
To address this, the company designed a targeted career development initiative, which included:
📈Outcome:
Within one year of implementing the program, the company reported:
💡Lesson:
When HR metrics highlight the “why” behind attrition, they empower organizations to make precise interventions that not only reduce turnover but also build loyalty and morale.
📍Scenario:
A fast-scaling technology company was struggling to fill key engineering and product roles. Time-to-hire for critical positions had extended beyond 60 days, slowing down projects and affecting product delivery.
🔍Action Taken:
Using data from its Applicant Tracking System (ATS), the HR team analyzed each step of the recruitment funnel. The insights were telling:
To fix this, the team:
📈Outcome:
The results were impressive:
💡Lesson:
Granular tracking of recruitment KPIs—like time-to-fill, candidate experience score, and interview-to-offer ratios—can reveal inefficiencies that, when resolved, accelerate hiring and attract better talent.
From these case studies, a few critical takeaways emerge for HR leaders looking to embed analytics into their workflows:
🔹 Data-Driven Interventions Are More Effective
Strategies rooted in employee data—rather than assumptions or anecdotes—lead to more focused and impactful outcomes. Whether it’s addressing engagement, turnover, or talent gaps, real numbers provide clarity and direction.
🔹 Continuous Monitoring Drives Sustainable Results
Metrics aren’t a one-time activity. Just like a business tracks financial performance quarter after quarter, HR must continuously monitor trends in workforce data. This allows for timely adjustments before issues escalate.
🔹 Cross-Functional Collaboration Is Key
HR doesn’t operate in a vacuum. These success stories show how partnering with operations, marketing, and IT (for tools) can elevate the impact of HR metrics. Strong collaboration often leads to faster implementation and broader adoption.
🔹 Culture Must Support Data-Driven Change
Both case studies saw success because leadership was on board and the organization was willing to act on the insights. Without this cultural buy-in, even the most insightful data won’t move the needle.
In today’s competitive landscape, HR metrics are no longer a “nice-to-have”—they are essential for making smarter, faster, and more strategic decisions. Whether you’re trying to improve retention, measure performance, enhance DEI, or monitor workplace well-being, the right metrics act as your guiding compass.
By collecting accurate data, leveraging smart analytics tools, and securing leadership buy-in, HR professionals can turn raw numbers into actionable insights. The key is not just tracking metrics—but understanding their story, aligning them with business goals, and using them to continuously improve employee experience and organizational performance.
So, if your HR department is still relying solely on instinct or tradition—it’s time to evolve. Metrics will not only help you prove your impact but also power the people strategies of the future.
The most valuable HR metrics vary depending on the organization’s goals, but several are widely considered essential for measuring workforce effectiveness and supporting strategic decision-making:
Together, these metrics help organizations attract, retain, and develop top talent while maintaining operational efficiency.
HR metrics provide a data-driven lens into the employee experience, making it easier to pinpoint areas that affect engagement. Here’s how:
By monitoring these indicators, HR teams can implement tailored engagement initiatives, such as flexible work policies, recognition programs, or career development paths—each designed to improve job satisfaction and organizational loyalty.
The best tools for HR analytics depend on the organization’s size, maturity, and data needs. Some top categories and examples include:
Organizations often integrate multiple tools for a comprehensive analytics strategy across the employee lifecycle.
The ideal frequency depends on the metric and business context, but here’s a general guideline:
Regular analysis allows organizations to respond proactively to trends while aligning workforce strategies with changing business conditions.
Yes, when used correctly, HR metrics can serve as powerful predictive tools. By analyzing historical and behavioral data, organizations can forecast:
For example, if mid-level employees with more than two years in a role and low engagement consistently leave within six months, predictive modeling can flag similar at-risk employees. This enables HR to intervene early with personalized retention strategies, such as mentoring, recognition, or growth opportunities.